Event log
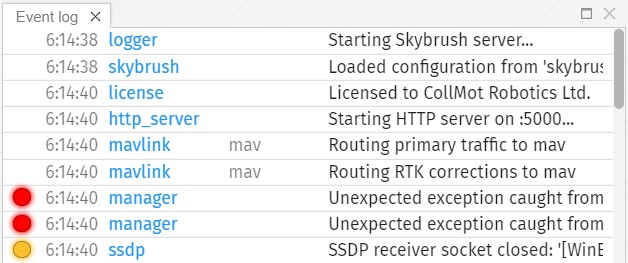
The Event log panel summarizes system messages received from the actively used Skybrush Server launched by Skybrush Live automatically.
If Skybrush Server is not launced from Skybrush Live automatically (see the Server Settings tab in the Preferences), but is running as a separate process, the event log window remains empty and server messages will be visible only on the server’s own terminal window.

Each event has the following information displayed from left to right:
-
severity: a colored status LED that indicates the severity of the message; possible severity levels are INFO (transparent), WARNING (yellow) and ERROR (red)
-
timestamp: hh:mm:ss format in local timezone
-
component: the name of the server component that has sent the message
-
component info: additional information about the server component that has sent the message
-
message: the actual message